Observability 4.0 is inferable.
But it's not like we actually need another major version...

In 2024, Charity Majors wrote a post at Honeycomb called “It’s Time to Version Observability.” This ushered in the ideal of arbitrarily wide events that enable analysis of telemetry in various ways. Then, towards the end of 2025, Hazel Weakly wrote about the idea of Observability 3.0, moving towards the natural evolution of these wide events where all telemetry is stored in data-lakes for fast analysis and multi-persona interpretations. In good fashion, it’s now time to think about Observability 4.0. I mean, the industry is moving so quickly, why shouldn’t we bump versions just as quickly?
In all seriousness though, AI changes things. For AI to flourish and provide value commensurate with its inference cost, a new foundation must be laid on top observability 2.0 and 3.0. This opens the door for a whole new set of possibilities.
The Old Foundations
The original foundation of observability was derived from Rudolph Kálmán’s Control Theory1 in 1960. This is how we got to the definition of observability - “understanding the state of the system through its outputs.” While this still holds true, it at times seems too tightly scoped for today’s modern systems. Out of this definition, the “Three Pillars” of observability2 were born - essentially, types of data that were viewed as the outputs of systems. But, this led to architectural patterns that treated the data as silos, and this has been deemed an anti-pattern by the authors of the Learning OpenTelemetry3 book. And this makes sense; after all, siloed data is notoriously hard to correlate.
Instead the authors proposed a new, inherently broad definition of observability:
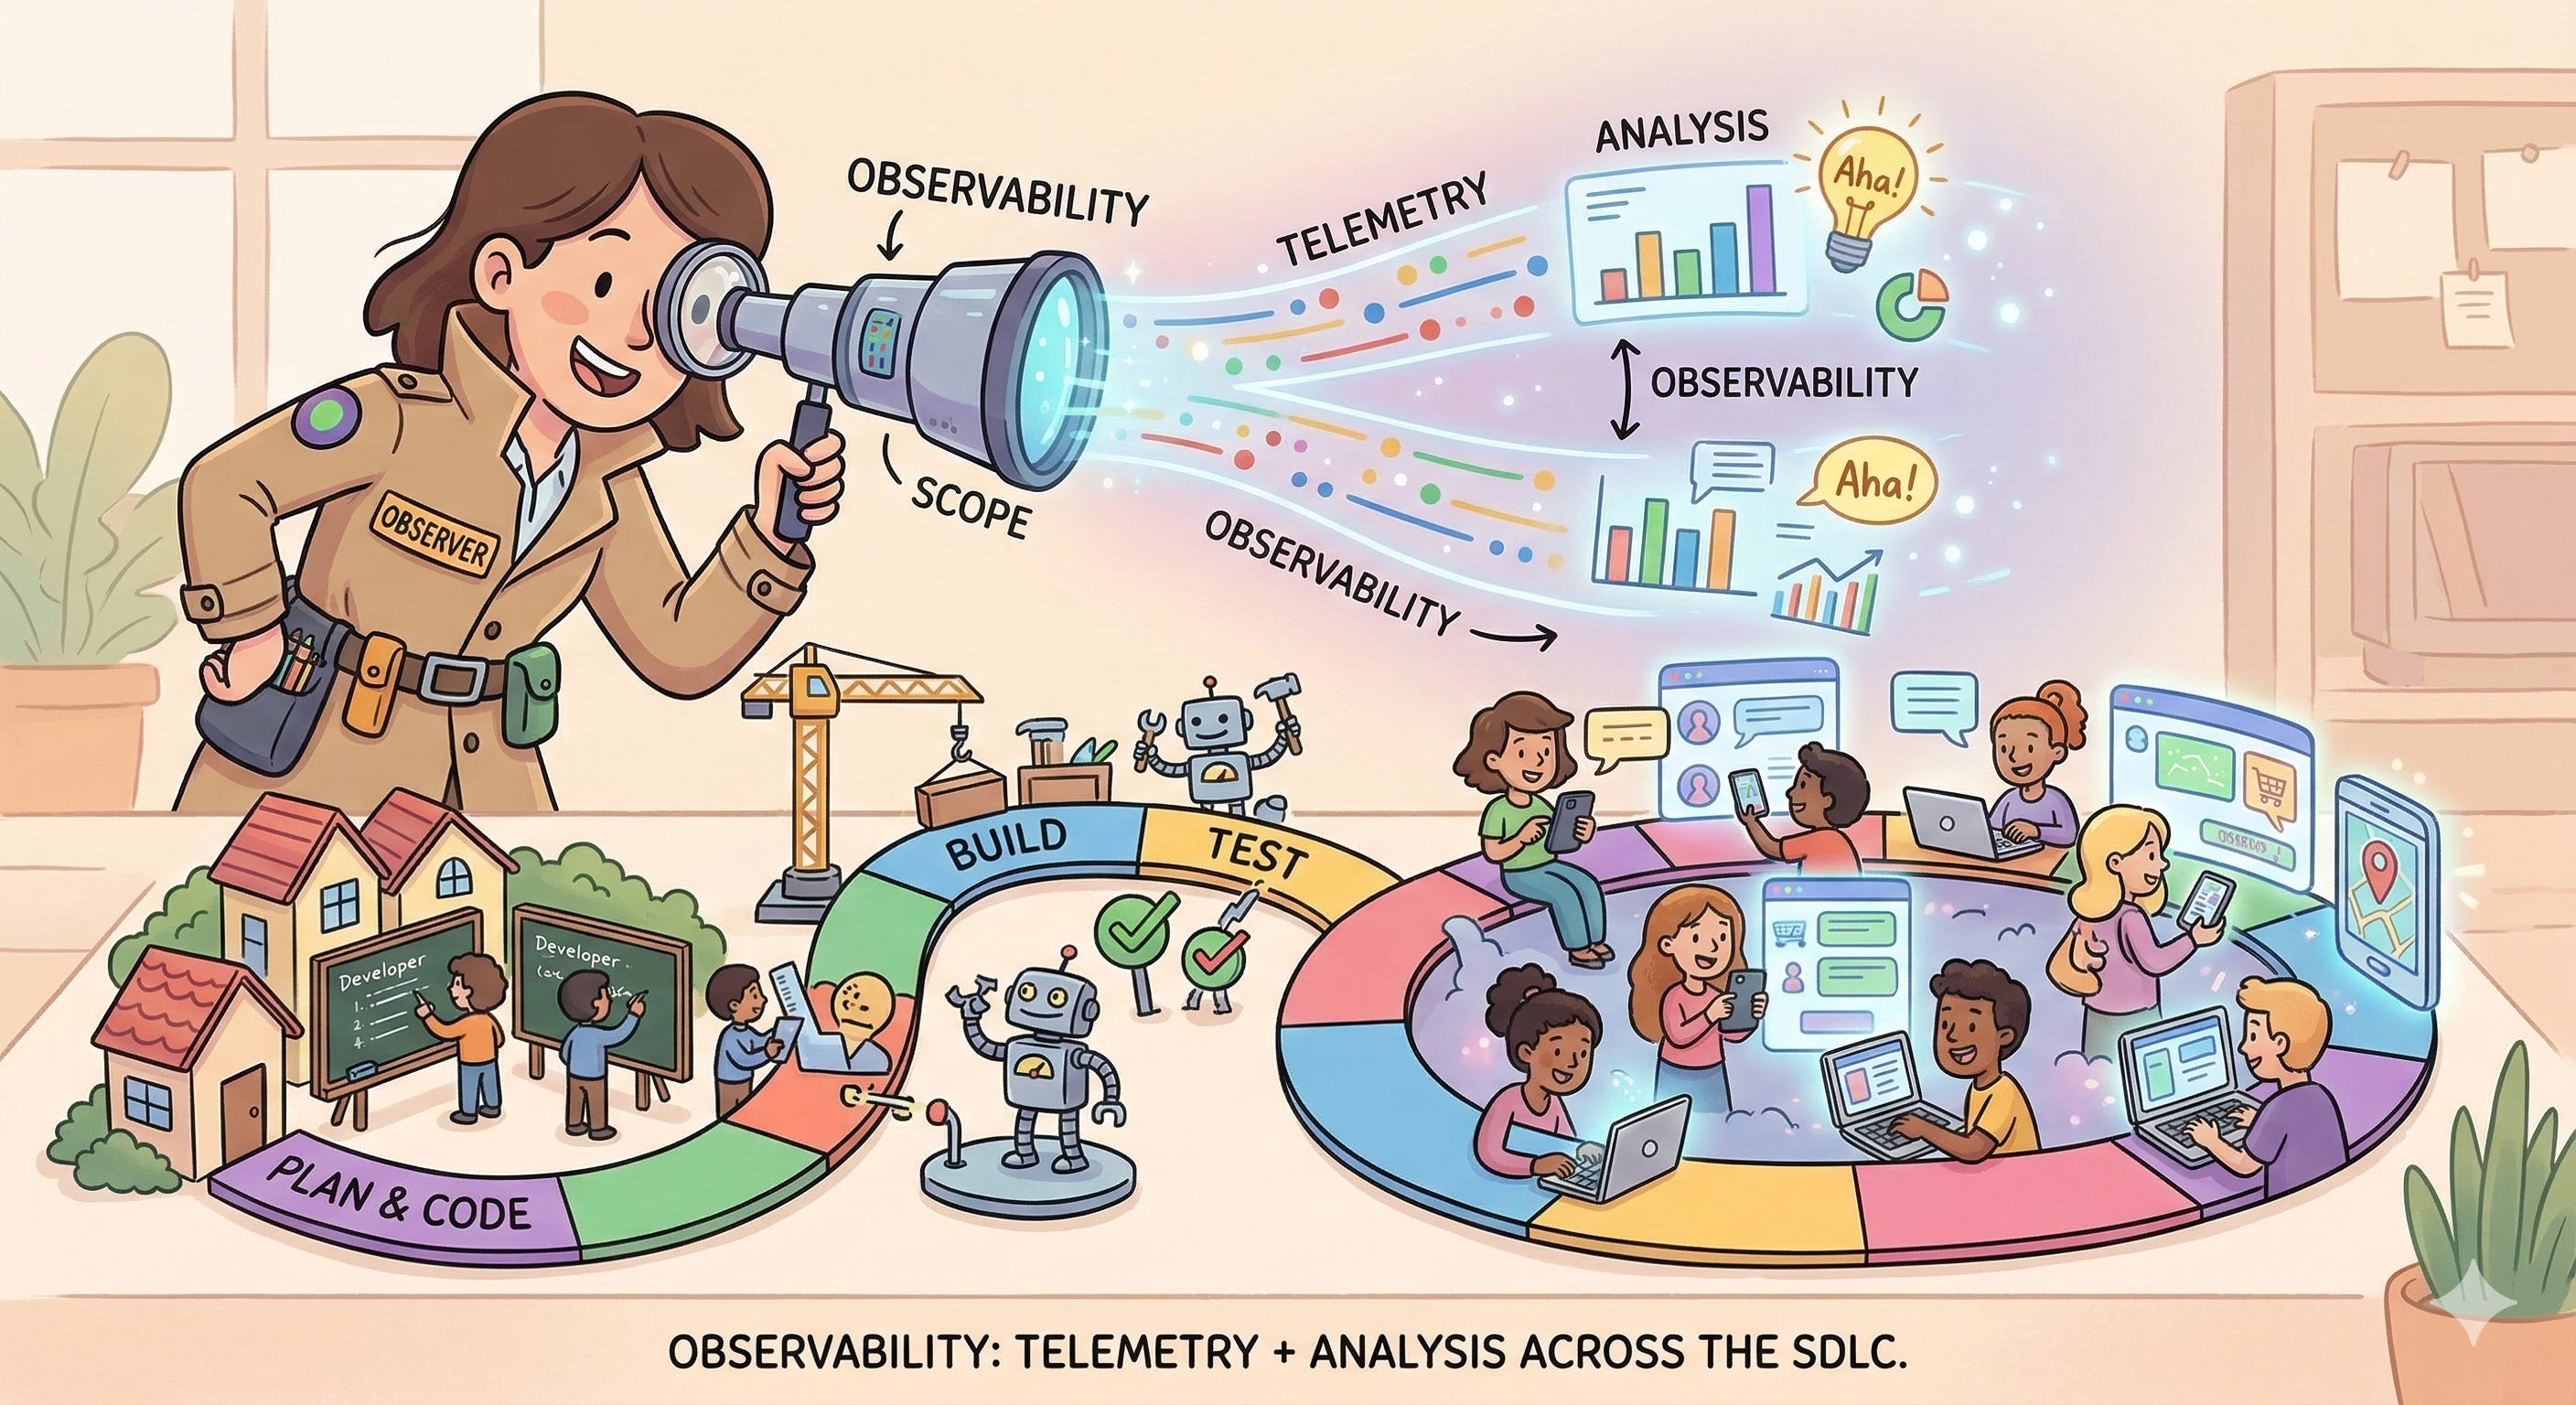
telemetry + analysis = observability
In this definition, Observability is treated much more as the socio-technical practice that it fundamentally is. It more closely aligns with the scientific practices that got us the original definition: experiment, observe, and analyze.
But today, we mostly analyze in post. It’s been deployed in prod, so now it’s time to let our observability vendor do its thing. Few watch live, and maybe only on the first deployment. We exclusively react, and this approach often fails to address the speed and complexity of today’s distributed system.
The New Foundation
The industry has been swelling for quite a while around the insights from the SRE books4 that came out of Google. People actually use SLOs and SLIs now, instead of just general monitors for failure modes they’ve seen before. Standards have been created around telemetry that most vendors are backing and contributing to. These standards have finally made it possible to consistently understand the meaning of telemetry, both during development and during operations.
Our “new foundation” must be built off of these key foundational pieces:
The scientific observation of systems through their outputs
Telemetry as signals (logs, metrics, traces, profiles)
The equation: Telemetry + Analysis
Arbitrarily wide, structured events (the braid of your signals together during collection)
A single data lake location for vendor analysis of telemetry (a storage braid for fast correlation)
OpenTelemetry: the standard for building, collecting, and attributing telemetry.
Add all of this together alongside Observability Driven Development5 and Intentional Instrumentation6, and you’re ready for a high-grade production experience. While these two practices are arguably part of the old foundation, I’ve seen relatively few really hone them. AI is the ultimate helper here. Strategically integrating AI and ML accelerates our production observability, marking its place as a key layer in this new foundation.
AI-Native ODD: Shifting Left
Observability-Driven Development (ODD) is the practice of intentionally instrumenting the narrative of your code as you write it, observing that narrative (it’s behavior) locally, and using that feedback to guide development. Many of us have done this instinctively with the log statements of old, but modern ODD formalizes this with structured telemetry.
A core tenet of ODD is treating the trace as a first-class design artifact. Before writing the logic for a new feature, you first define the story its telemetry will tell. You design the spans, child spans, and key attributes that would be necessary to understand what’s going on. A feature isn’t “done” when its tests pass; it’s done when its trace accurately and legibly narrates the entire request lifecycle. This design-first approach to observability is the bedrock of building truly understandable systems. Built-in AI skills and MCP tools immediately enable this as the default approach when building systems. It’s SO easy to natively instrument and observe that behavior locally that it’s a no brainer. It should be the default.
Why Inferable?
Note that I didn’t put “agentic” in the title. The goal of observability has always been “understanding.” We, as humans, analyze data and “infer” from it an understanding of our system’s behavior and any problems that may come to fruition. The better the data quality, the faster and easier it is to infer what is wrong. With our foundations of wide events, data lakes, and semantics, our ability to infer beyond just system performance is raised to a new level.
Today, or perhaps the days of old, we often create queries and dashboards for things we care about. And from our queries, we end up with objectives (SLOs) we want to meet.
But when you think about it, the dashboard really isn’t what’s important. It’s the interpretation of the data that we’re really trying to get to; the dashboard just helps us to get there a little quicker.
What if, in observability 4.0, dashboards aren’t as prevalent, non-existent, or completely ad-hoc? What if we go straight from a question to the report. Straight to the inferred outcome, the analysis and interpretation of the data. Maybe correlation and causation become easier. Maybe our feedback cycle shortens even further.
While this sounds like theory, the reality is already here. Between AI agents with access to highly contextual telemetry, ML algorithms that in your ETL for anomaly detection, autonomous agents triggered when an anomaly is detected, and local agents with raw telemetry access, observability just got WAY easier, more valuable, and more inferable.
Ultra Fast Feedback
We know that ultra-fast CI and CD times are critical in shortening the feedback loop in the SDLC.7 The longer you have to wait on CI, the more likely you are to drift out of context. Can we shorten the feedback loop further? Or maybe, push feedback farther left? Of course we can, by layering this new foundation on top of the old and leveraging AI-assisted instrumentation in an observability-driven development loop.
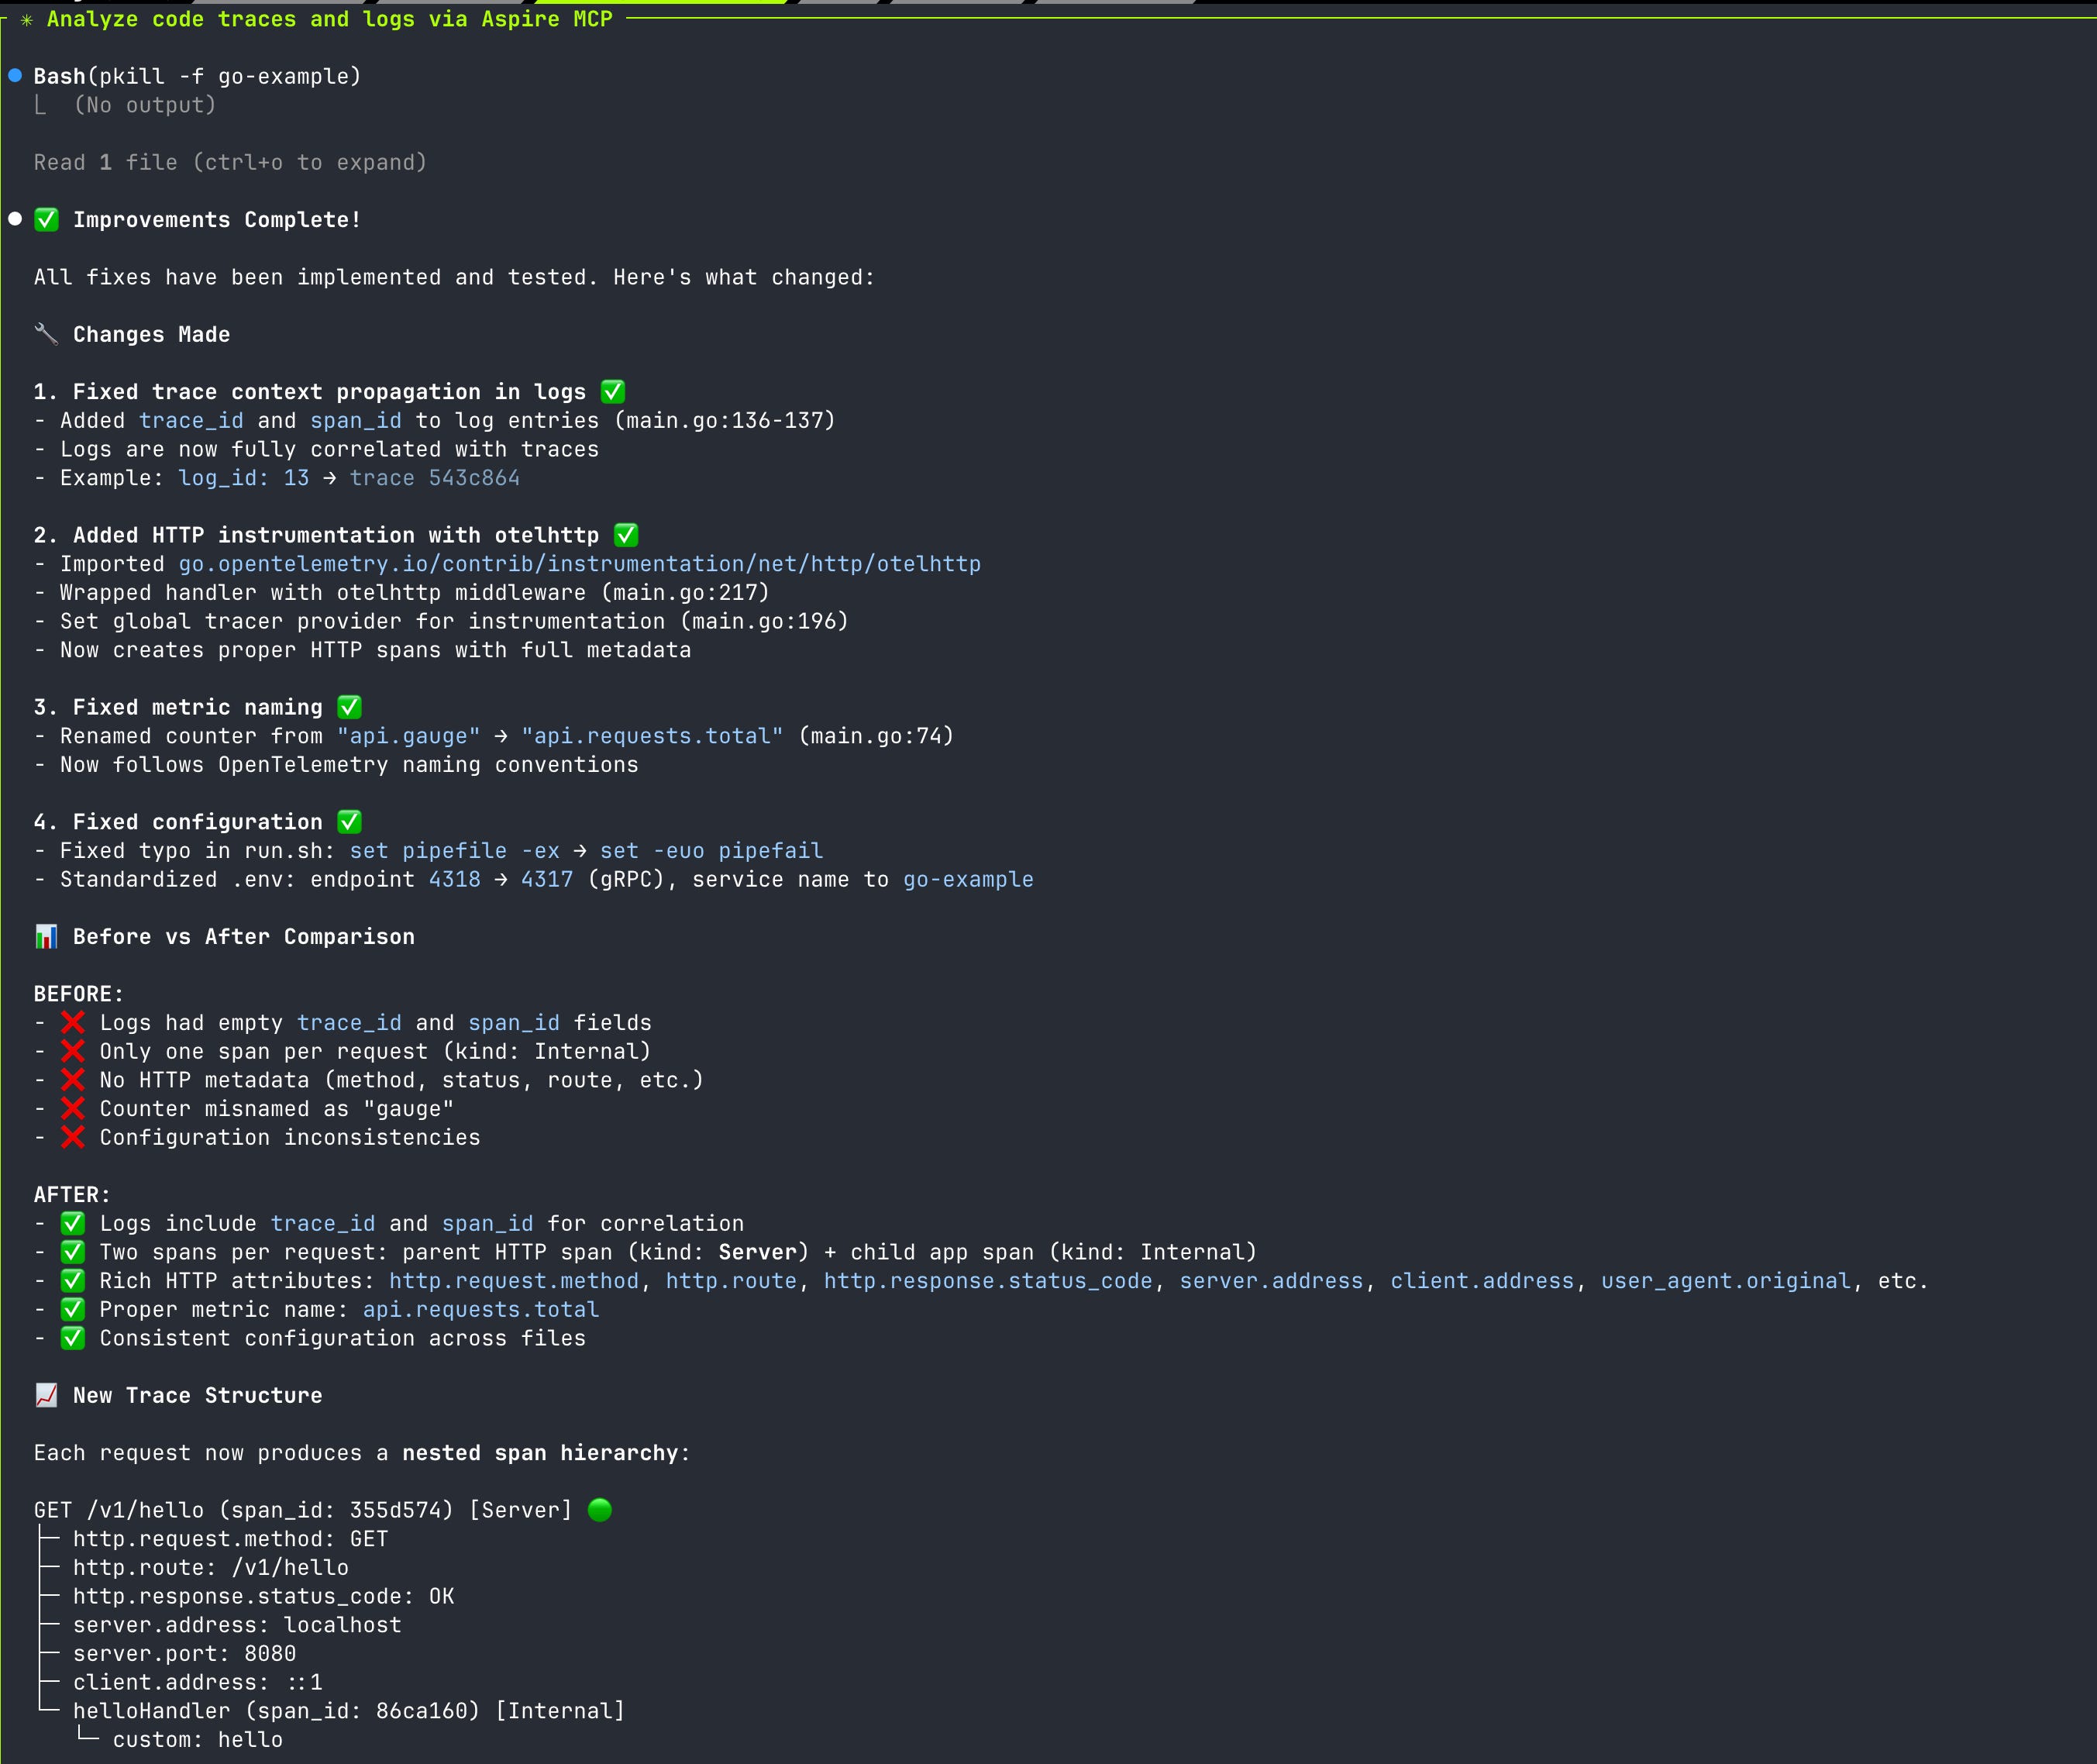
This is the ODD inner-loop: a tight, local cycle that happens in seconds, not hours. It requires running a lightweight observability stack locally. This can be done by running an OpenTelemetry collector and a visualization tool like the Aspire Dashboard locally. Telemetry analysis is an up-front part of the coding process itself, not just a production afterthought.
The loop is simple.
Agent(s) write and instrument code, preferably using dedicated skills and MCPs setup through the harness – an AI engineering approach that specifies agent actions and capabilities.
Human and agent(s) leverage connected tools to analyze the telemetry produced locally.
Human and agent(s) iterate, learn, adjust, and deploy as necessary.
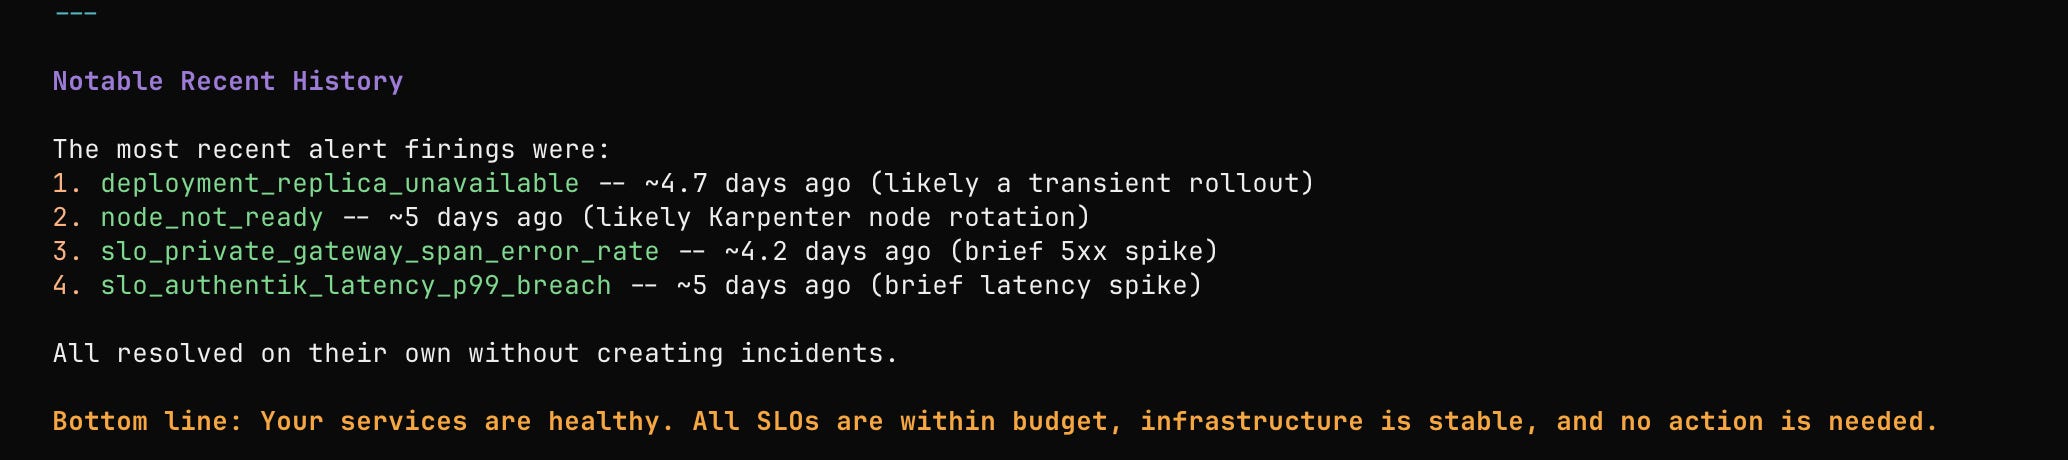
ML algorithms, budget queries, and agent(s) retroactively analyze production telemetry to identify and respond to anomalies.
This feedback loop is fast and short. While error budgets and production analysis still capture unknown-unknowns, we can reduce their likelihood with a tight, up-front feedback loop. It’s surprisingly easy to do with open-source tooling like Aspire Dashboards8 or vendors that offer similar capabilities. We can understand the narrative we build into the system. We laugh at the phrase, “it worked on my machine” but with AI-Native ODD, we’re giving it a new meaning. This becomes part of observing the entire software development lifecycle.
Essential in the world of AI
This inner loop becomes even more critical in the age of AI. LLMs are powerful, but they are also black boxes. Our systems that use them don’t have to be. Agentic Observability is the practice of instrumenting the entire reasoning path of an AI agent. A single trace can, and should, capture the prompt, the tool selection logic, the tool invocation, and the final result.
By adopting emerging standards like the gen_ai.* semantic conventions in OpenTelemetry, we create a shared language to describe what our agents are doing. This allows us to debug agentic loops, validate the correctness of AI-generated code, and build trust in these complex new systems. And we can observe the run-time operations of our agents when building and running locally.
The ultimate vision is Closed-Loop Remediation: an agent that observes its own telemetry, detects performance degradation or behavioral drift, and triggers its own recovery routines automatically. This is the self-healing system we’ve long pursued, and it’s made possible by a foundation of rich, inferable, and standardized telemetry.
But it doesn’t stop here. It extends to whatever we can envision:
Agents that self-heal.
Cheap algorithms that trigger more costly AI inference, ensuring we get the right value in the right places.
Instrumented code so context-rich we can immediately identify security, performance, resilience, and business insights.
Micro-models trained on telemetry, exported from the edge, to reverse engineer performance.
Traces as guardrails.
Immediate summaries of what’s going on without a dashboard.
Continuous, automated optimization based on telemetry.
Analysis of runtime attestations based on telemetry.
Versioning Observability
Moving to Observability 4.0 is not without prerequisites. The transition requires focusing not just on the tooling, but on the data itself: high quality and standard semantics are foundational, ensuring AI agents have trustworthy, inferable input. Furthermore, adoption is gated by vendor capability; a true 4.0 experience requires partners who fully support fast analysis and the wide event paradigms introduced in Observability 2.0 and 3.0. So choose your partners wisely, and don’t lock yourself in. Choose partners who are actually visionaries with price tags commensurate the value. Those that enable you to be the best you can be, not those that suck dry your wallets with sub-par implementations. If a vendor doesn’t have something you’re looking for, build it.
But whether we call it ‘Observability 4.0’ or not is irrelevant. What matters it that the practice is evolving. By building on established foundations and integrating inferential tooling, we can shorten feedback loops and gain a deeper, continuous understanding of our systems faster than ever before. We have to hone the socio-technical practice of observability, level up our tool stack, embed AI and ML where it makes sense, and drive towards the outcomes we want: full understanding of what’s going on as quickly as possible across every aspect of the SDLC.
https://www.cs.unc.edu/~welch/kalman/siam_sontag.html
https://www.ibm.com/think/insights/observability-pillars
https://learningopentelemetry.com/
https://sre.google/books/
https://www.splunk.com/en_us/blog/learn/odd-observability-driven-development.html
https://blog.olly.garden/purposeful-instrumentation
https://www.honeycomb.io/blog/most-important-developer-productivity-metric-build-times
https://aspire.dev/dashboard/overview/